

Dump files contain things happening in your computer memory during a crash, including likely causes and problematic files. Over time, I have used these files to determine whether I needed to roll back device drivers or repair system files.
I’ll show you everything you need to know about dump files and how to read them. You’ll also learn how to use the Windows driver verifier to configure Windows to create the necessary .dmp file to troubleshoot BSODs.
What Are System Error Memory Dump Files?
Windows generates memory dump files whenever it crashes due to a critical error, such as a bug check (BSOD) error.
These files contain snapshots of your computer memory at the moment of the crash. It includes important information, such as:
- Programs and processes running at the time of the crash;
- Drivers loaded to the system memory when the crash happened;
- The malfunctioning file connected to the error;
- Names and brief descriptions of the error messages and codes.
Dump files have the .dmp extension and you can only read them using specialized software.
Types of .dmp Files
There are various types of dump files that contain different information. You’ll be selecting a specific type of file when configuring Windows to create crash dumps. Let’s go through them:
Complete Memory Dump
A Complete Memory Dump is the largest of the dump files. It contains everything loaded onto the system’s RAM. That means it takes up a significant chunk of storage space. However, it provides the most comprehensive information compared to other types of dump files.
Active Memory Dump
An Active Memory Dump is a filtered version of the Complete Memory Dump file. It includes only the memory pages considered relevant for troubleshooting to reduce file size and declutter information.
Kernel Memory Dump
This file contains only information related to memory used by Windows’ core (the kernel). It is smaller than the Complete Memory Dump but provides critical data. However, it does not include information from the user-dedicated memory.
Small Memory Dump
Also called Minidump, this is the most compact dump file type. It stores only essential information about the crash, including stop codes, a list of loaded drivers, and basic details of running processes.
While other dump files can be found in %systemroot%\MEMORY.DMP, you can find Small Memory Dumps in the %systemroot%\Minidump folder.
How to Open .dmp Files
Your computer can only create and save memory dump files if you turn on the settings. Follow these steps:
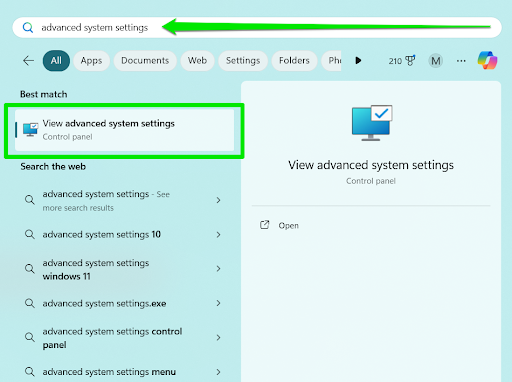
- Launch the Start menu and type advanced system settings.
- Click View advanced system settings in the search results.
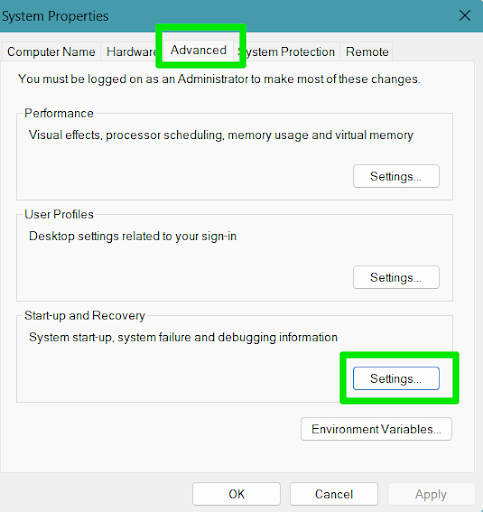
- When you see the System Properties window, go to the Advanced tab and click Settings under Start-up and Recovery.
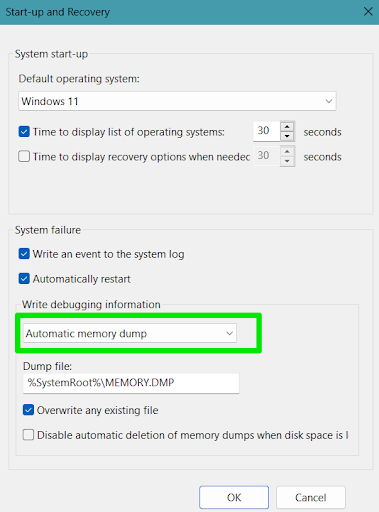
- Now, go to the System failure section and select Automatic memory dump under Write debugging information.
- Click OK and restart your computer.
The next time your computer shows a stop code and crashes, it automatically saves a dump file in your Windows root folder.
Opening the dump file involves using a specialized software application, such as Microsoft’s WinDbg, to read and analyze it.
How to Read .dmp Files
We’ll show you how to read Windows dump files and analyze them using WinDbg and BlueScreenView. Let’s begin.
Using WinDbg
WinDbg is Microsoft’s main debugging tool that helps developers find errors within their drivers and applications. It used to be part of Microsoft’s SDK (Software Development Kit), but it is now available as a standalone program that anyone can use to read and analyze Windows dump files.
How to read the dump file using WinDbg:
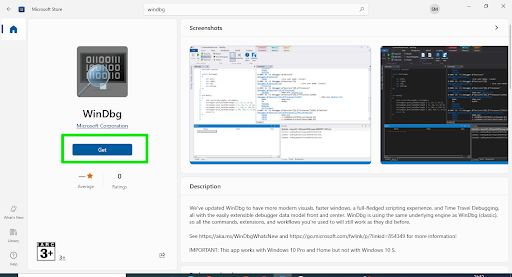
- Head to the Microsoft Store and search for WinDbg.
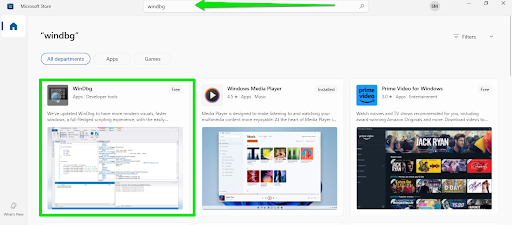
- Click the Get button.
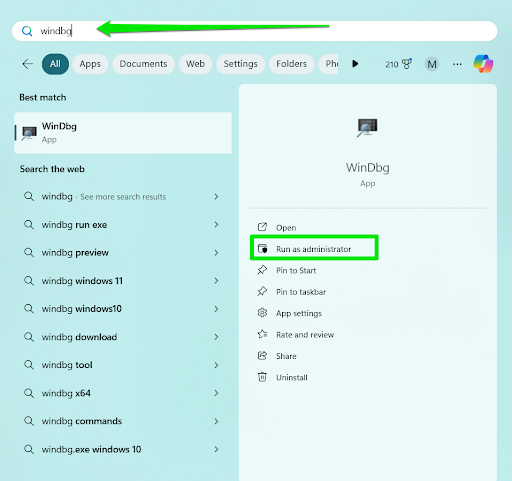
- After the program is installed, open the Start menu, search for it, and run it as an administrator.
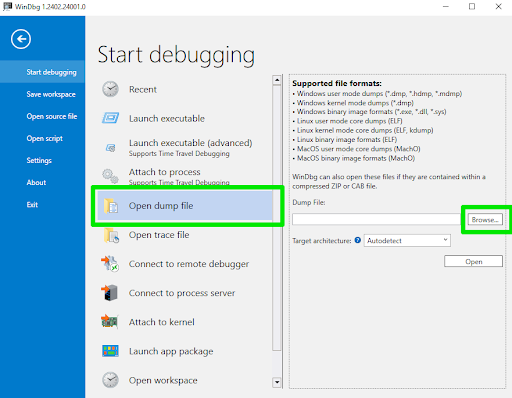
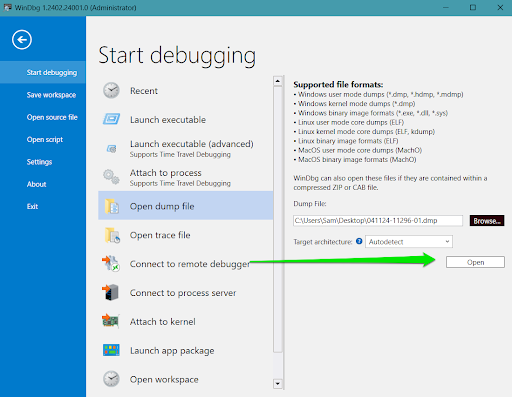
- After WinDbg opens, click File in the top-left corner, select Start debugging, and click Open dump file.
- Go to the right side of the window and click the Browse button.
- Go to the location where Windows saved the .dmp file and double-click it.
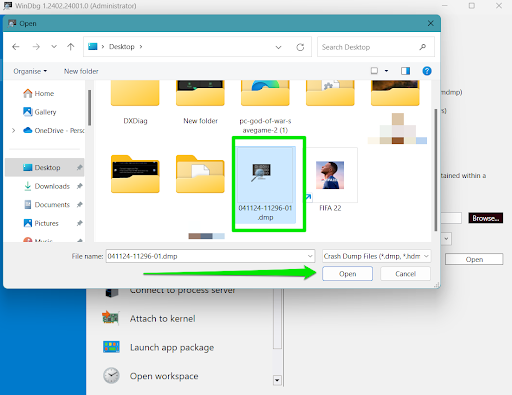
- Click the Open button after selecting the file and allow the application to load it.
- Now, go to the command line at the bottom of the page, type !analyze -v, and hit the Enter button.
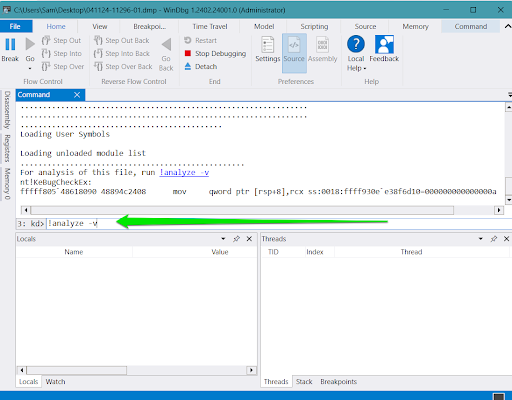
Allow the process to complete, as it may take a while, depending on the size of your dump file. The progress bar at the bottom of the window should indicate when the application finishes the analysis.
How to analyze the Windows dump file in WinDbg:
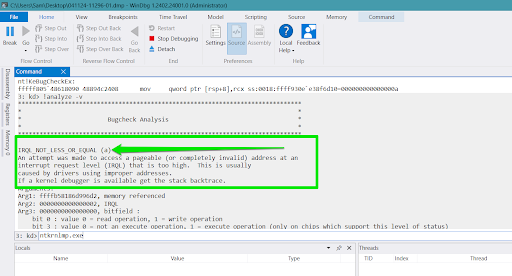
- Once the analysis is complete, WinDbg will display a block of text in the Command tab. It starts under Bugcheck Analysis.
- You’ll find the name of the BSOD, alongside a short description. In my case, it’s the IRQL_NOT_LESS_OR_EQUAL stop code.
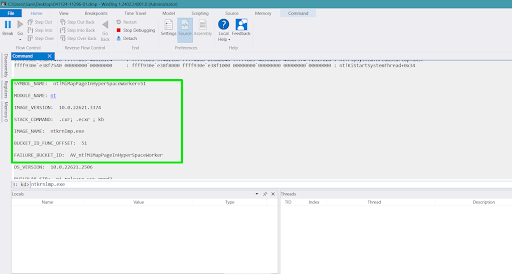
- Scroll down through the page until you see SYMBOL_NAME, MODULE_NAME, IMAGE_VERSION, e.t.c.
- The MODULE_NAME indicates the name of the affected service, and the IMAGE_NAME indicates the affected file.
Using BlueScreenView
BlueScreenView is a freeware application with an easy-to-use interface. It allows you to drag and drop your dump file and automatically displays its information without extra input.
How to read your dump file in Windows 11 and Windows 10 using BlueScreenView:
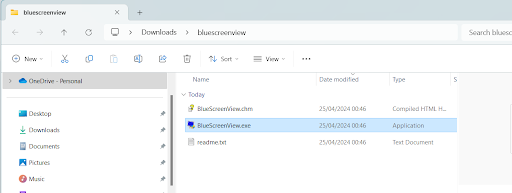
- Go to Nirsoft’s BlueScreenView webpage and scroll to the bottom to download the tool. Downloading the ZIP package is the fastest way.
- Extract the ZIP file and double-click BlueScreenView.exe to open the program.
- If your dump file is in your C:/Windows folder, the tool will automatically load it.
- However, you can open a separate folder, locate the dump file, and drag it to the BlueScreenView window.
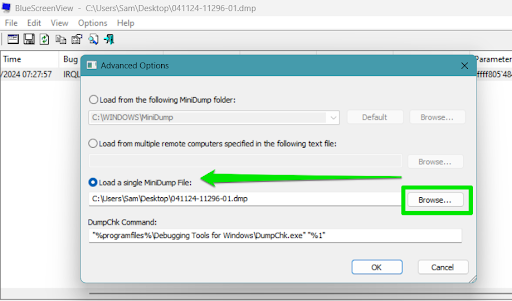
- You can also press CTRL + O to open the Advanced Options window. Here, you can choose the Load a single MiniDump file option, click the Browse button, select your dump file, and click OK.
How to analyze the dump file in BlueScreenView:
- You should now see everything you need to know in the top section of the window, including Time, Bug Check String (BSOD name), Bug Check Code, and Caused By Driver.
- The Filename section will highlight the specific file that caused the problem.
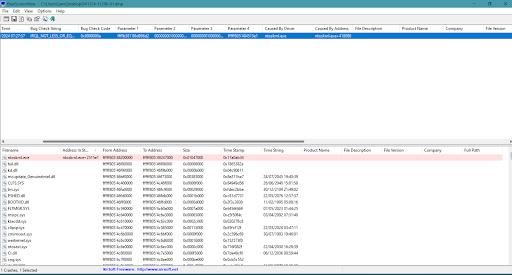
The file and BSOD name should direct your next steps.
Using Windows Driver Verifier to Create Dump Files
If you only recently configured Windows to create dump files after critical errors, you have to wait for the blue screen or system crash to happen again before you can get the dump file. However, you don’t have to wait if the problem is caused by a driver.
You can run Windows Driver Verifier to help you troubleshoot drivers and create the dump file. Verifier is a built-in program that monitors drivers. You can run it to check for improper driver behavior so that you can figure out the cause of a blue screen error.
Follow these steps:
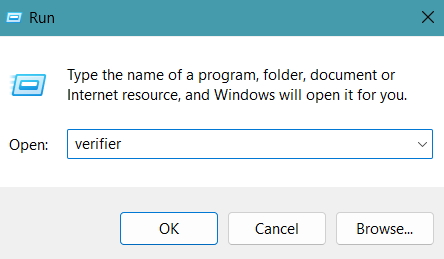
- Right-click the Start icon on your taskbar and select Run.
- Type verifier in the dialogue box and click OK.
- Press Yes in the UAC dialog to run Driver Verifier Manager.
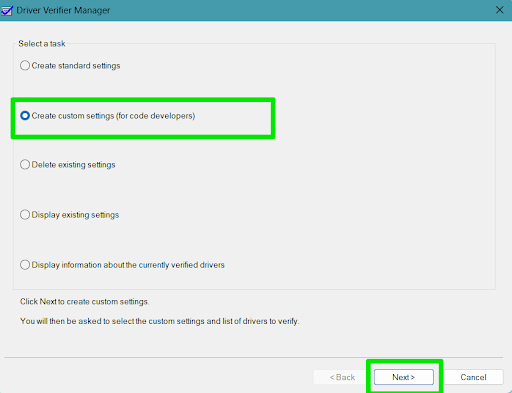
- Select Create custom settings (for code developers) and click Next.
Check every option in the next window except DDI compliance checking and Randomized low resources simulation.
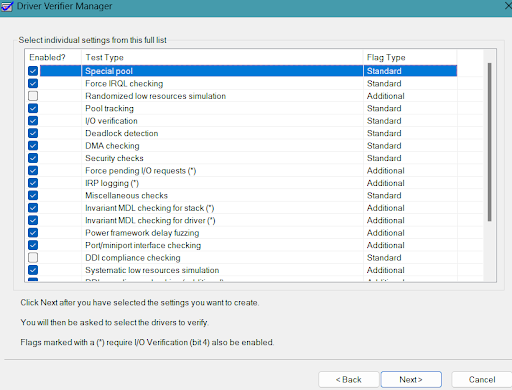
- Click the Next button.
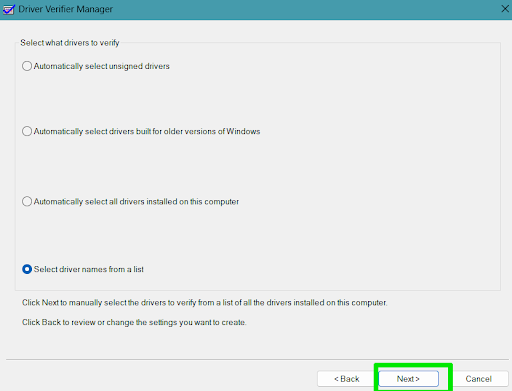
- Choose Select driver names from a list and click Next.
- Once the driver list appears, select every option except Microsoft Corporation drivers.
- Click Finish and restart Windows.
After restarting your computer, Driver Verifier will now run in the background to test your drivers. You can run the same programs that crashed it earlier to check if the problem recurs. Use the methods shown above to read the dump file created after the crash.
If the crash does not occur, then a system file or Windows driver likely caused the BSOD.
Easily Read Dump Files in Windows
As you’ve noticed, the process is not too complicated. You can go through Microsoft’s Bug Check Code Reference page to read about the BSOD error you saw in the dump file. Remember to keep your drivers up to date, keep malware away, and perform regular PC maintenance to avoid BSODs.
Head to the comments section below to tell us whether you successfully read your crash dump file.